Trading, Natural Resources
 Earlier in the year we looked at an indicator that had a 95% correlation with the S&P 500 index. While at first it may seem bizarre, the indicator was simply the copper to gold ratio.
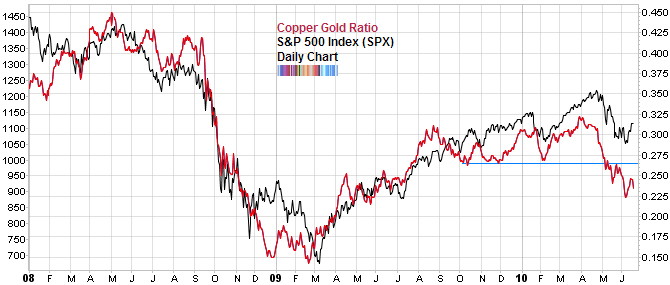
While the copper/gold ratio and the S&P 500 had enjoyed a remarkably parallel trajectory, one was beginning to outrun the other. Since then, this pattern has only continued. As you can see from the chart below, while the equity markets continued to make new highs, the copper gold ratio spent about 9 months going sideways (from August 2009 to April 2010).
Most recently, while the S&P 500 index managed to maintain itself above the February correction, the copper gold ratio fell significantly below it.
There are several explanations. The first is that the relationship between the two is simply breaking down. I don’t think that is the case since the connection between the two is based on a tangential relationship. After all, copper is the most ubiquitous metal and is known as “Dr. Copper” for its ability to predict economic activity.
The other is that the relationship continues but one will eventually realign itself with the other. In that case, the lower price of copper is either signaling an upcoming economic contraction (with a decline in stock prices) or the other way around; that the copper gold ratio or copper (priced in gold) increases as economic activity continues and realigns itself with the higher stock prices.
Either way, I think we simply return to the battle royale between fundamental indicators and technical indicators.
1 commento:
good start
Posta un commento